DORA metrics have become the standard answer to measuring team performance. I’d start somewhere else. A team can look great on all four DORA numbers and still spend most of its energy on things that matter to nobody, and none of the four will warn you. The five metrics below will.
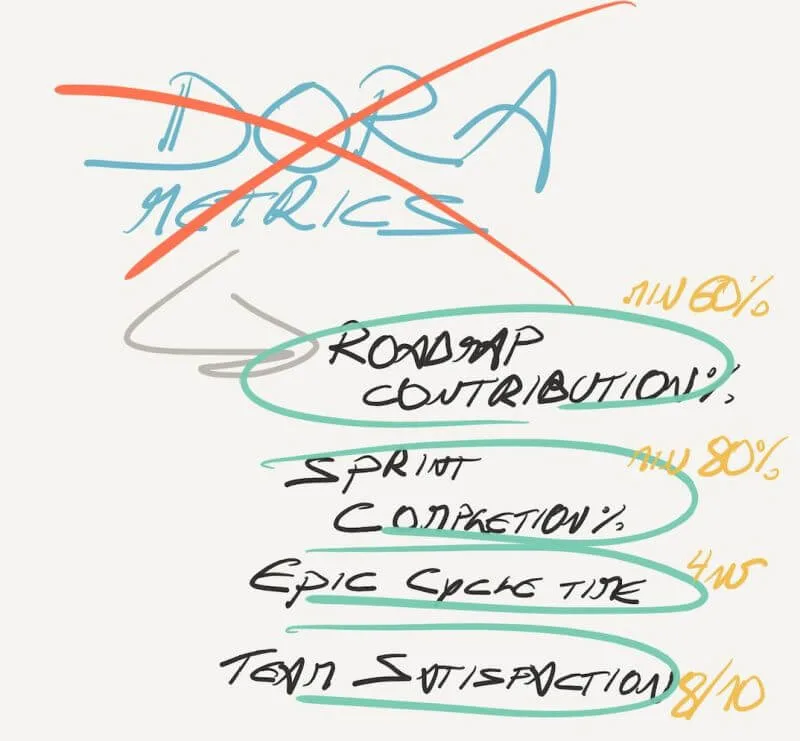
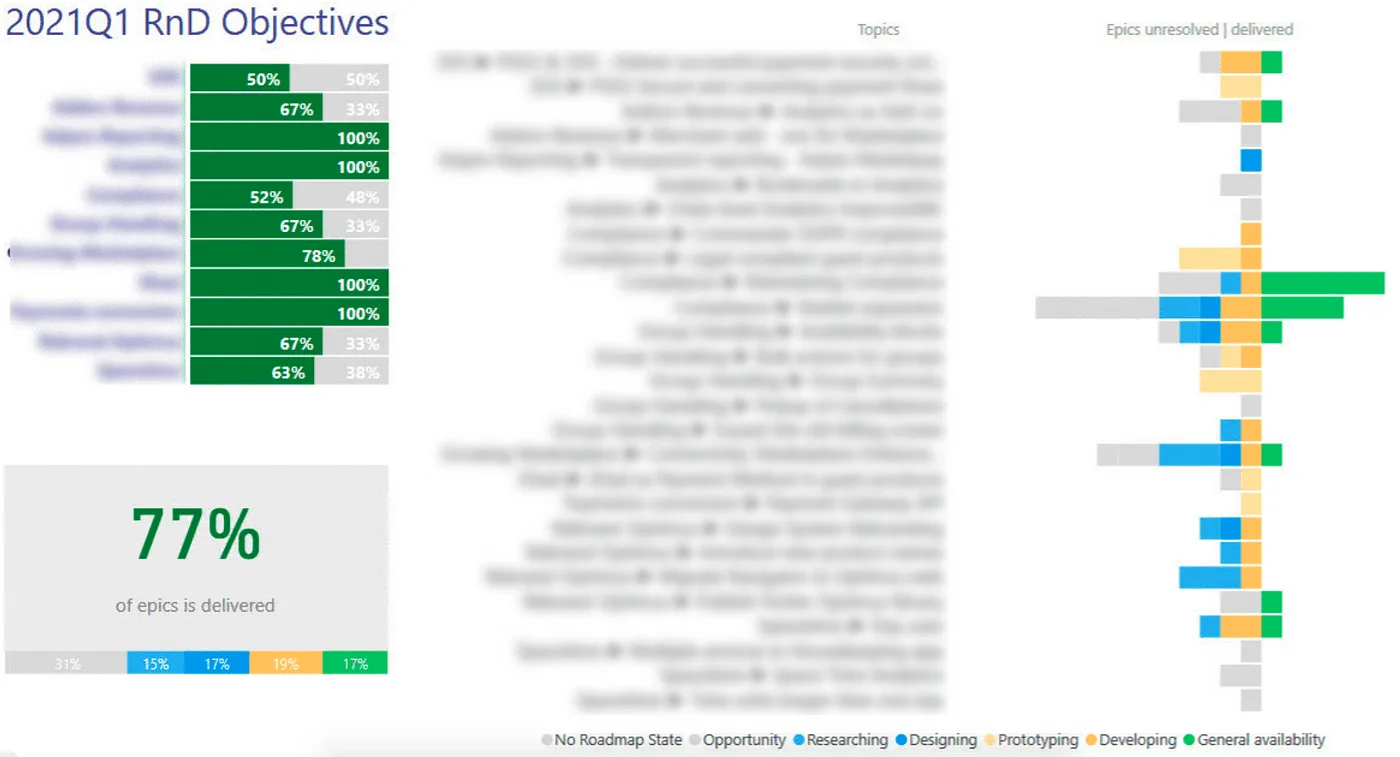
1. Roadmap Contribution
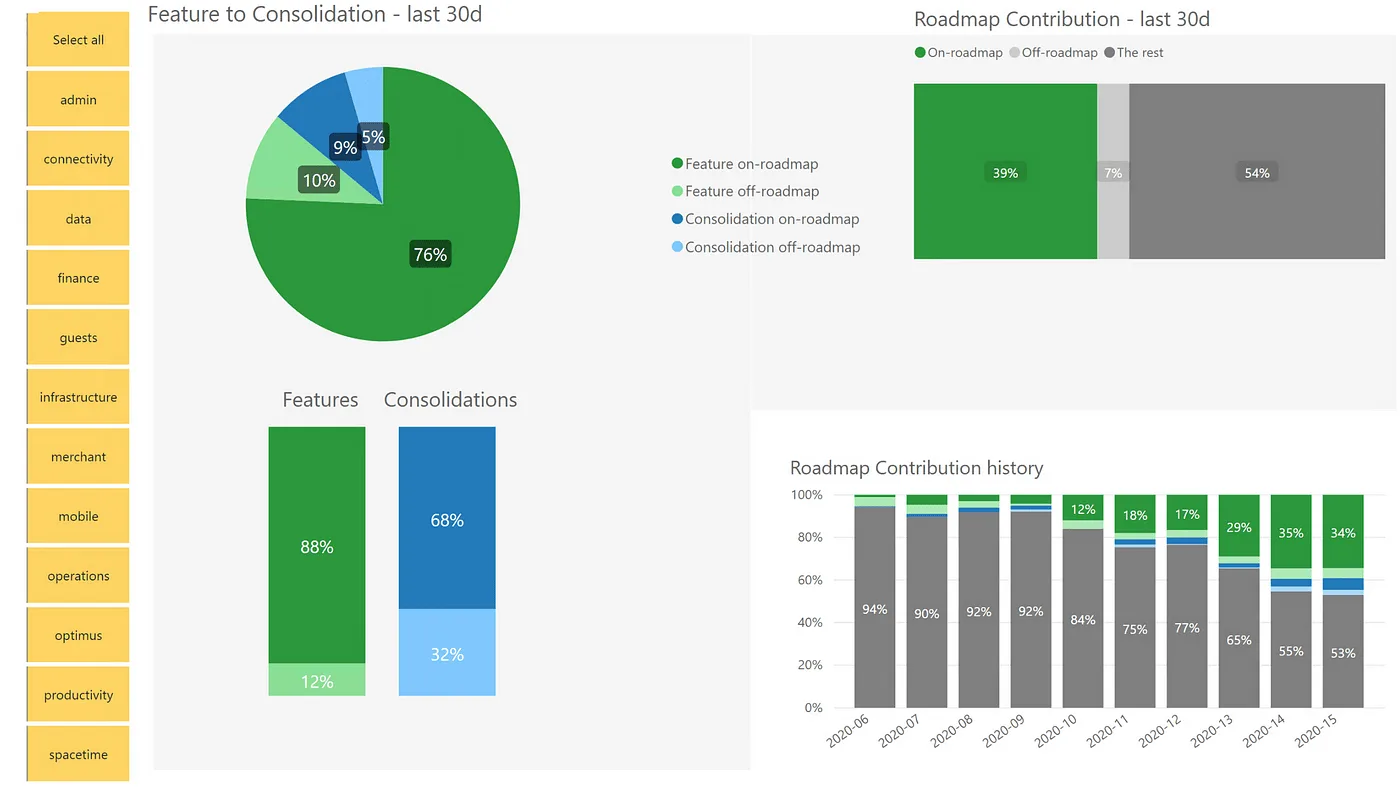
The amount of time your team spends on key roadmap items is the first thing I check. My threshold: 50-80%, so that high performance stays aligned with the overarching goals. A fast team building the wrong things is just expensive busy work.

? What’s the purpose of having expensive highly performing teams if they don’t work on things that matter the most, having 60% off-roadmap contribution?
2. Sprint Completion
Sprint completion rates, ideally above 80%, reflect how well the team plans and executes. In my experience, a lower rate often signals underlying trust issues, and trust issues bleed into productivity and morale.
3. Epic Cycle Time
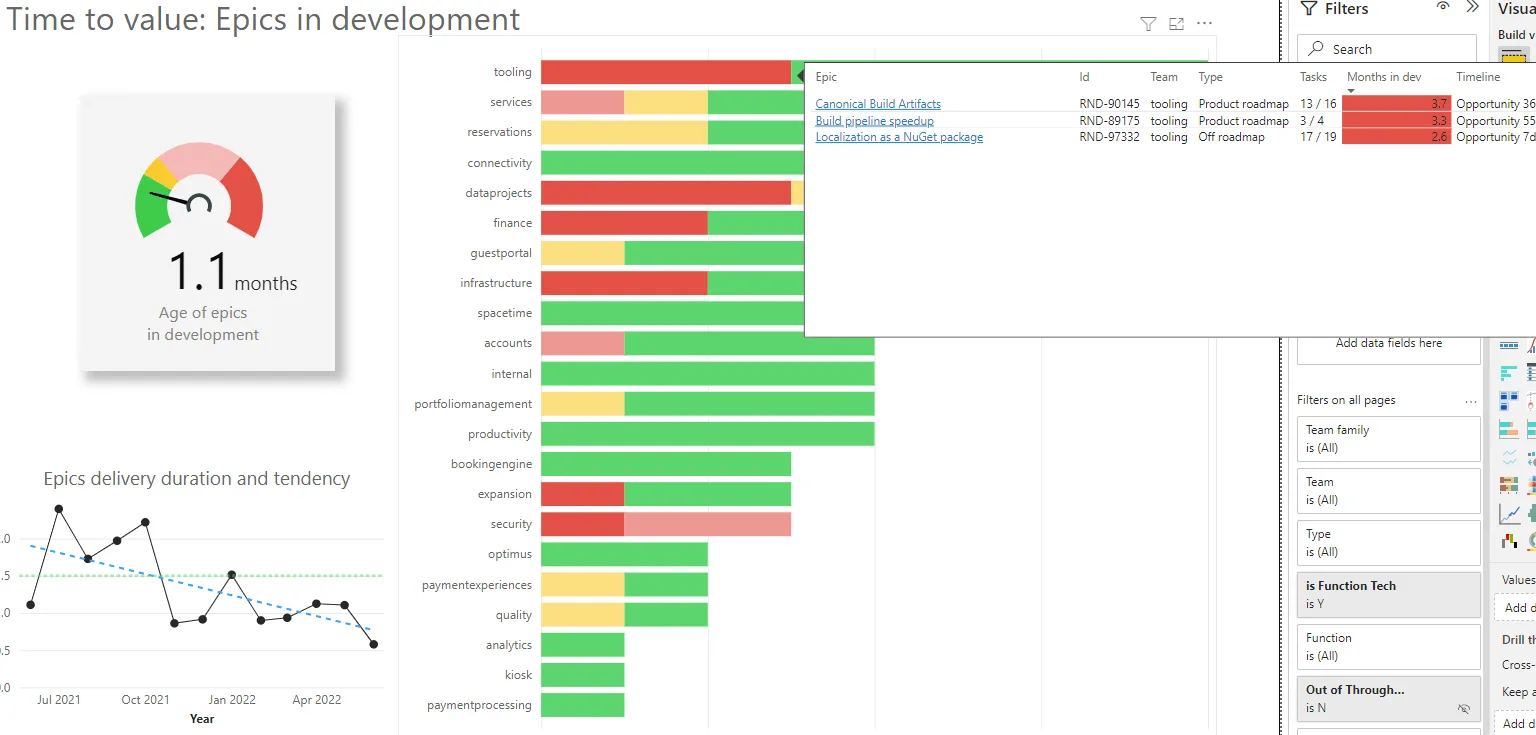
Forget traditional task cycle times and Jira burndown charts. Focus on Epic Cycle Time, with a median target of 4-5 weeks. Epics are what your customers receive, as opposed to tasks, which is why this number tells you more about delivered value than any burndown chart ever will.
4. Team Satisfaction
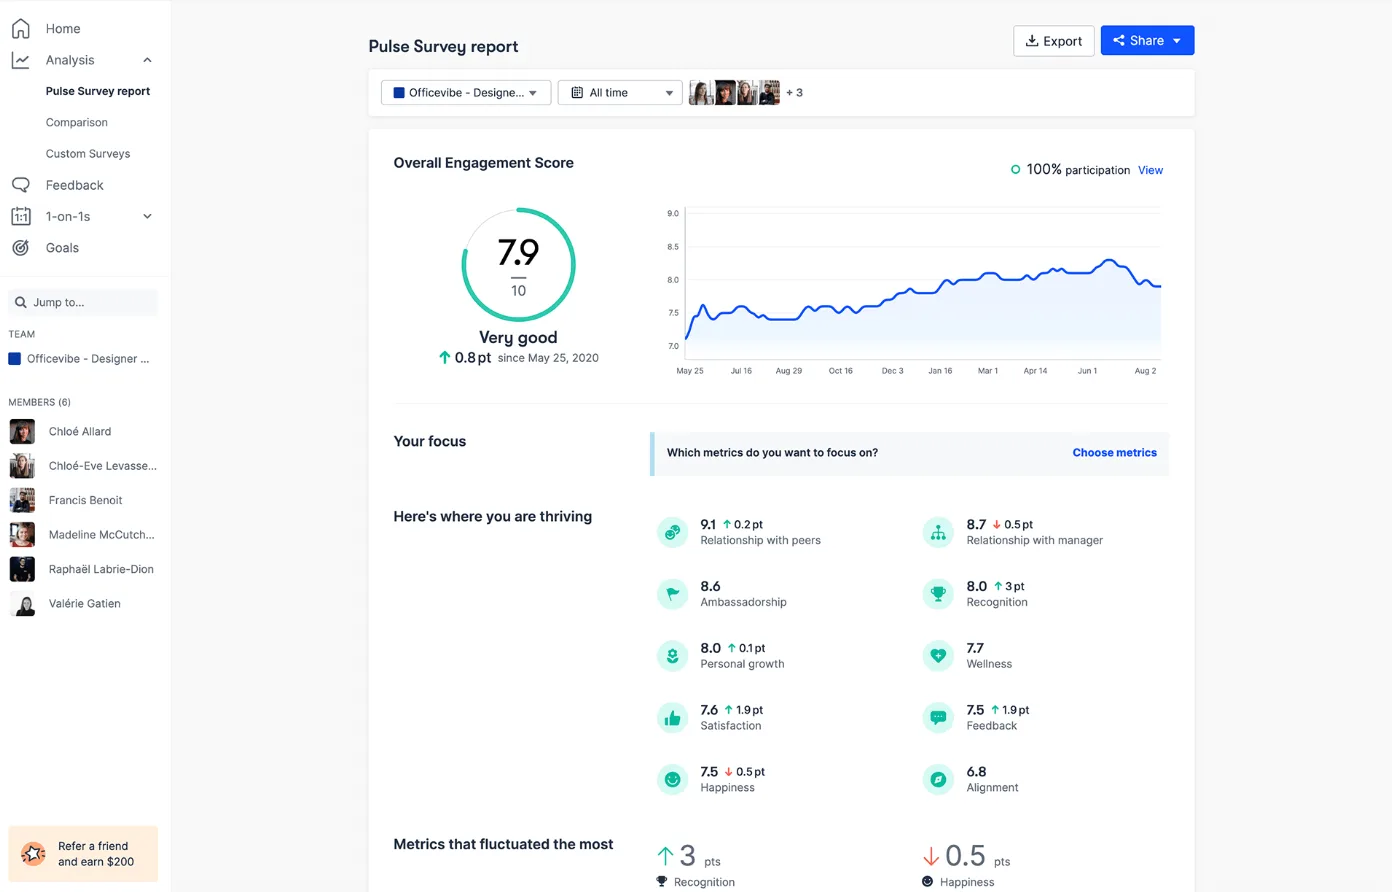
Run a continuous survey on a 0-10 scale and aim for around 8. A sudden drop is a red flag, and the whole point is that you see it while you can still act.
It’s a huge money-saver, preventing the team destabilisation.
5. Adoption RATE
Measure how many increments have been successfully accepted and adopted by your customer. Threshold: min 65%.
Conclusion: A Broader Perspective on Team Metrics
Start with these five. Add DORA later, if you still need it. Together they give you a broader view of your team’s effectiveness than any code-centric metric can.
Closing
If you’re wondering where to start, there’s a free open-source Jira data extraction tool available, with all data required: https://github.com/marian-kamenistak/jira-lead-cycle-time-duration-extractor